Measuring, Monitoring, and Modeling Ecosystem Cycling
Aug 5, 2020 at 10:05am
The terrestrial biosphere—the regions of Earth’s land surface that support life—continuously exchanges carbon and water with the atmosphere. Plants capture atmospheric carbon dioxide (CO2) through valves in their leaves, converting the gas into compounds for growth through photosynthesis and respiration. Meanwhile, water moves from the ground through plant roots and stems to leaves, where it is gradually released, or transpired, back into the atmosphere.
Changing climate conditions may shift the balance of ecosystem carbon and water cycles by altering plant processes like photosynthesis, transpiration, and respiration.
Globally, the biosphere removes about 30% of the CO2 emitted by human activities from the atmosphere and returns almost 40% of the rainfall it receives back to the atmosphere through transpiration. However, changing climate conditions may shift the balance of ecosystem carbon and water cycles by altering plant processes like photosynthesis, transpiration, and respiration.
Each ecosystem responds uniquely to warmer temperatures, altered precipitation patterns, and higher atmospheric CO2 [Baldocchi et al., 2018]. For example, one black spruce forest in Alaska that once removed carbon from the atmosphere has become a net carbon source. As autumn temperatures have warmed and the rate of decomposition has increased (thereby increasing respiration, which releases CO2), the forest now releases enough carbon to the atmosphere to outpace an increase in photosynthesis (which takes up CO2) [Ueyama et al., 2014]. In contrast, forests in the U.S. Midwest and Northeast increased their removal of carbon from the atmosphere relative to the amount of water they lost through transpiration, thanks to increasing levels of atmospheric CO2, which allow plants to capture carbon more efficiently [Keenan et al., 2013].
The View from Three Perspectives
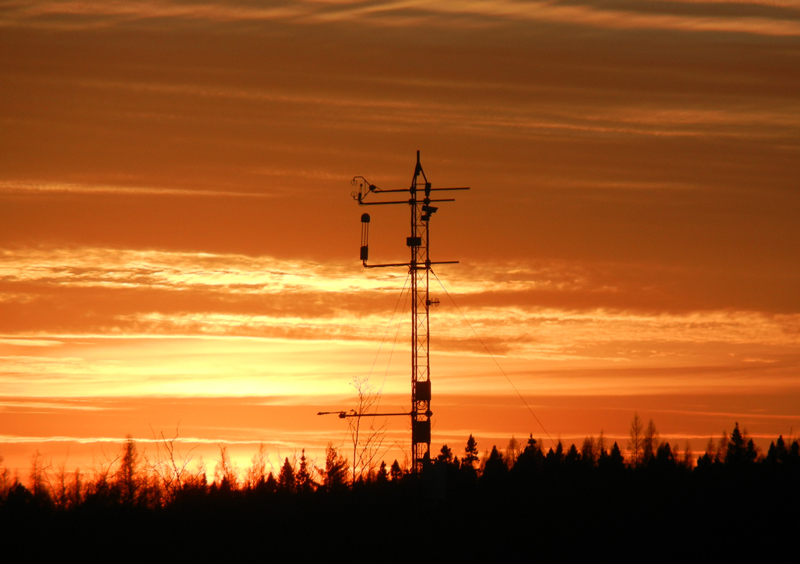
To detect these trends and identify their biophysical and environmental drivers, scientists measure and monitor ecosystem carbon and water exchanges, or fluxes, in diverse ecosystems around the world. One source of data in the Western Hemisphere, the AmeriFlux network, consists of tower-based sensors that collect in situ eddy covariance measurements of the turbulent exchange of gases between Earth’s surface and the atmosphere. This network started out with just 15 sites in 1996. Through grassroots efforts by individual scientists, the network has grown to comprise more than 300 stations located in every major ecosystem of North, South, and Central America [Novick et al., 2018]. Many of these measurement sites have recorded data for more than 2 decades, enabling scientists to leverage this resource to examine how ecosystems are changing over time [Baldocchi, 2020].
The ground-based measurements from AmeriFlux are complemented by airborne and satellite remote sensing products, which monitor larger areas and expand the spatial coverage afforded by the monitoring network. Scaling up ground station measurements helps bridge the spatial discrepancy between site observations and models that simulate ecosystem processes at much coarser resolutions.
These ecosystem models represent the scientific community’s collective understanding of ecosystem functioning developed over decades of discovery [e.g., Lawrence et al., 2019; Zhu et al., 2019]. They are useful tools for testing hypotheses and refining our understanding of ecosystem functioning. Ecosystem models can be used to disentangle the ways that different components of the ecosystem are responding to changing environmental conditions and to project how those changes may modify carbon and water cycling under future climate conditions.
The combination of long measurement records, new remote sensing products, and advances in ecosystem modeling has enabled researchers to investigate previously intractable questions and to identify important processes driving observed ecosystem responses to changing environmental conditions. Four key areas of research emerged from discussions at a workshop held last October at the Lawrence Berkeley National Laboratory in Berkeley, Calif., and organized by the RUBISCO-AmeriFlux Working Group. Reducing Uncertainty in Biogeochemical Interactions through Synthesis and Computation (RUBISCO) is a U.S. Department of Energy–sponsored project focusing on analysis of carbon-climate interactions. Here we highlight each of the four areas.
Ecosystem Trend Spotting
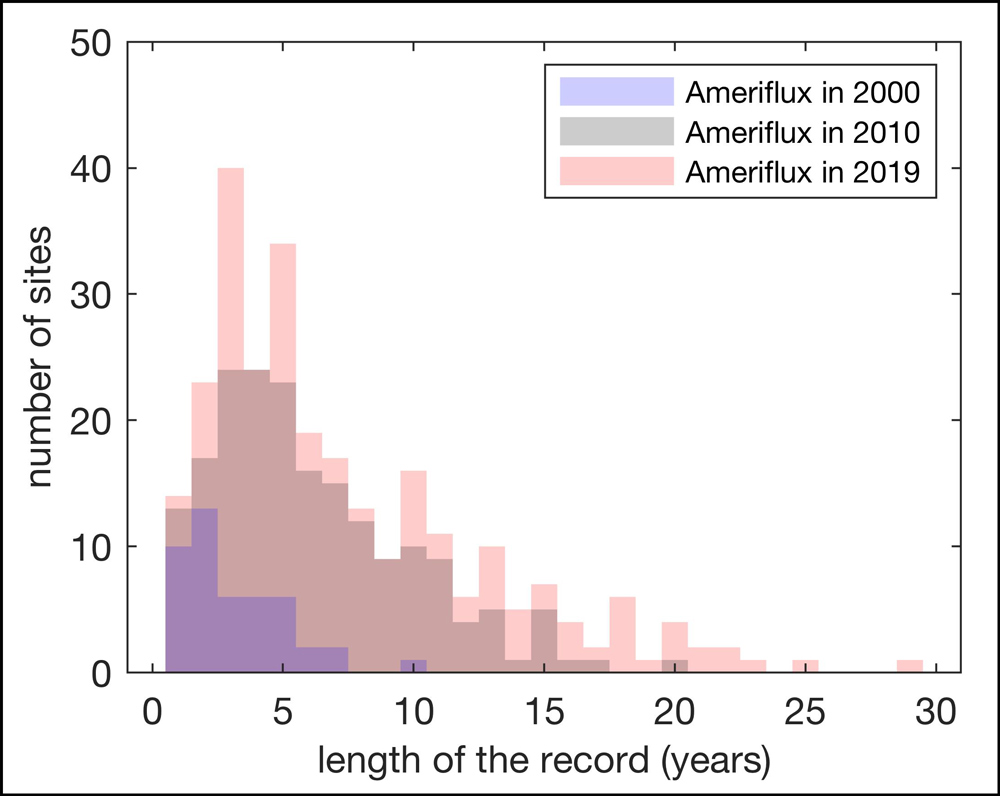
As of 2019, the AmeriFlux network included 63 sites that have been operating for more than 10 years (Figure 1). As AmeriFlux and similar sensor networks continue to collect data, the length of ecosystem carbon and water flux records grows. With these records, scientists are beginning to detect trends in ecosystem metabolism and to disentangle the multifaceted responses of ecosystems to elevated CO2, climate change, and human disturbances [Baldocchi, 2020].

Several aspects of ecosystem functioning are essential to changes in terrestrial carbon, water, and energy budgets: water use efficiency, light use efficiency, net ecosystem exchange, and evapotranspiration (ET). To quantify trends in these ecosystem functions, we used the newly available standardized version of the AmeriFlux data set processed using the Open Network-Enabled Flux (ONEFlux) pipeline, a code package compatible with the global FLUXNET2015 data set [Pastorello et al., 2017]. The resulting ONEFlux data set was developed to remove a bottleneck that has long hindered the syntheses of AmeriFlux data derived from multiple sites [Novick et al., 2018], and it contains more site-years and up-to-date observations in the Americas than the widely used global FLUXNET2015 data set.
Scientists with expertise in in situ measurements, partitioning evaporation and transpiration, and land modeling are collaborating to quantify trends in ET, attribute environmental drivers of the observed trends, and model projected future changes. Having diverse perspectives within the team helps advance novel approaches and build collaborations among scientists at different career stages.
Ecosystem Responses to Extreme Events
To understand how ecosystems may respond to changing climate conditions, we can look at how these ecosystems fared under extreme weather conditions in the past. If models accurately simulate how ecosystems responded to past heat waves, dry spells, and flooding events, then these models can be used to project how future climate conditions may affect ecosystems and alter carbon and water exchanges. Long-running AmeriFlux measurements have captured decades of weather events, providing a valuable test bed for evaluating model performance.
Prior to the workshop, researchers from nine modeling centers around the country performed simulations at AmeriFlux sites using observed local weather and site characteristics. We compared model simulations to observed measurements from a wide range of ecosystems, including a piñon-juniper forest in New Mexico, a maple-poplar forest in Indiana, and an oak savanna in California. Overall, various ecosystems had diverse responses to extreme weather events. The maple-poplar forest slowed photosynthesis to conserve water during a severe drought event in 2012. On the other hand, the New Mexican piñon-juniper forest used up available soil moisture for photosynthesis quickly after summer rain events, as is typical for ecosystems that must take full advantage of infrequent rainstorms.
Some models captured ecosystem responses better than others; by comparing the mathematical representations of plant processes in models that perform well, researchers aim to improve our understanding of plant functioning. Improving model representations of ecosystem carbon and water cycling during extreme weather events improves model projections of future ecosystem vulnerabilities, which can inform conservation efforts.
Untangling Contributions to Carbon Exchange
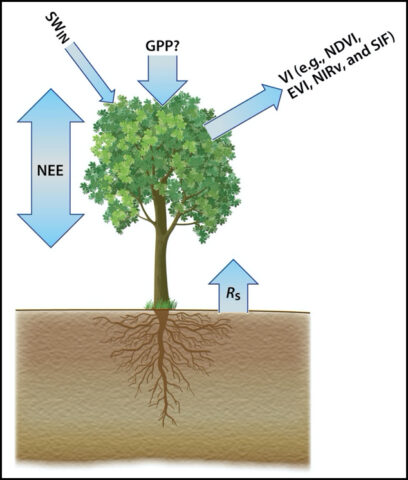
Two main components influence the net exchange of carbon between ecosystems and the atmosphere: gross primary productivity (GPP) via photosynthesis and ecosystem respiration (Reco). The net ecosystem exchange (NEE) measured at the AmeriFlux sites is partitioned into GPP and Reco components by extrapolating statistical relationships either between nighttime NEE and temperature or between daytime NEE and light. Daytime and nighttime partitioning methods may yield different results, both of which are equally plausible. Without independent complementary measurements, it is challenging to evaluate the partitioning of GPP and Reco from these two methods. When such complementary measurements are integrated with eddy covariance observations, they increase confidence in the AmeriFlux GPP and Reco estimates (Figure 2).

Soil respiration measurements such as those from the continuous soil respiration database (COSORE) serve as one source of measurements to complement eddy covariance data. Reco is composed of autotrophic respiration (Ra) by plants making their own food and heterotrophic respiration (Rh) by microbes gathering food from plant or animal matter. Soil respiration (Rs) is composed of Rh and the belowground (root) fraction of Ra. Soil respiration can be used to estimate GPP by constraining the belowground fraction of Ra and the autotrophic fraction of Rs.
Another complementary data source, satellite-derived vegetation indexes, serves as a proxy for light interception by the tree canopy. These indexes appear to be promising alternatives to direct flux measurements for GPP estimation [Huang et al., 2019]. Additionally, solar-induced chlorophyll fluorescence, a measure of energy flux emitted from plants, can track the seasonality of GPP at high spatial and temporal resolution [Magney et al., 2019]. Together, GPP and Reco estimated from multiple data sources will improve partitioning methods and make estimates more robust.
Scaling Up from Sites to Ecosystems
Eddy covariance flux observations collected across AmeriFlux sites provide valuable data for confronting, diagnosing, and constraining the representation of ecosystem carbon, water, and energy cycle processes in terrestrial ecosystem models. However, these site-based observations are not representative of the entire ecosystem where they are located. The spatial mismatch with regional-scale models complicates model benchmarking and improvement [Metzger, 2018]. Spatial scaling of site-based flux observations to regional landscapes using multiscale observations is critical to reducing uncertainties in flux estimates and constraining models.

At the workshop, scientists combined bottom-up and top-down approaches for scaling fluxes across space. In the bottom-up approach, a recently developed environmental response function technique involving a data assimilation system is applied [Metzger, 2018]. The complementary top-down approach uses airborne measurements from NASA’s Atmospheric Carbon and Transport (ACT)–America campaign, which measured atmospheric carbon and water concentrations during five campaigns over three regions in the United States between 2016 and 2019. ACT-America took spatially sparse, but frequent, airborne measurements that provide regional-scale constraints on carbon and water exchange rates [Schuh et al., 2019]. The proposed combination of bottom-up and top-down approaches provides spatially explicit observations enabling regional-scale evaluation of carbon, water, and energy cycles in ecosystem models.
A Collaborative Working Session
Last October’s workshop inverted the standard meeting format: Rather than coming together to present results, attendees met virtually prior to the workshop to determine the most pressing questions and assemble tools and expertise. By the time the workshop kicked off, scientists were ready to start tackling the questions together.
This workshop format was a highly effective model for advancing collective objectives in a diverse research community, bringing together scientists from a wide range of disciplines, career stages, and perspectives. By pooling resources, they made rapid progress toward identifying and advancing some of the most pressing questions in the field. And working together in person helped integrate early-career scientists into the community and form lasting collaborations.
