2005 Baseline Data Report
The Baseline Data Report (BDR) was prepared for Napa County in 2005 to catalog and assess baseline environmental conditions countywide on a number of select resource topics in support of the 2008 General Plan Update. BDR is envisioned as a “living” document and database that will continue to support planning and resource management efforts in Napa County into the future. Over time, the BDR will require updates and maintenance so that information remains current and reliable. The Napa County Planning, Building and Environmental Services (PBES) is the steward of the BDR and related data. The following summarizes the 2005 BDR topic areas. The full 2005 BDR can also be downloaded.
Physiography, relief, and drainage of Napa County
Napa County is part of the hilly to steep mountains of the California Coast Range. The county is characterized by a number of northwesterly parallel mountain ridges and intervening valleys of varying widths.
The soils in Napa Valley generally are very deep and have high potential productivity. They are used for vineyards, orchards, and pastures. The soils in the southern part of the valley have lower production potential because they are limited by a strongly developed subsoil. They are used mainly for dryland pasture and for oats and hay.
Maacama Mountain rises abruptly on the west side of Napa Valley. The soils in this area are moderately deep to very shallow over sandstone and shale, and they are used mainly for range, wildlife habitat, and watersheds. A few areas of moderately sloping soils are used for vineyards.
The mountain ridges on the west side of the valley extend as far south as Napa, where the landscape consists of rolling hills and dissected terraces. The soils in this area are moderately deep over sandstone and shale or are shallow to a claypan. They are used for range, pasture, and vineyards.
Howell Mountain borders Napa Valley on the east and rises abruptly from the valley floor. The soils in this area are moderately deep to shallow over rhyolitic tuff and basic igneous rock. They are used for timber, range, wildlife habitat, and watersheds. Where this ridge broadens to a plateau near Angwin, some areas of soils are used for vineyards and orchards.
The plateau drops off to the northeast into Pope Valley, and Vaca Mountain rises abruptly to the east. The soils in the northern and eastern part of the county are moderately deep to shallow over sandstone, shale, and serpentine. They are used for range, wildlife habitat, and watersheds.
The Napa River and its tributaries drain the western part of the county. The Napa River flows southward from north of Calistoga into San Pablo Bay. The northeastern part of the county drains into Lake Berryessa by way of Putah Creek and its tributaries. These tributaries drain Snell, Pope, and Cappel Valleys and part of Chiles Valley.
Sources: Soil Survey of Napa County, U.S. Department of Agriculture, Soil Conservation Service, in cooperation with University of California Agricultural Experiment Station, August 1978
Faults of the Napa River Basin
The Napa River watershed is a northwest-trending structural and topographic depression (Hearn et al. 1988) that has largely evolved since the early Pleistocene (about 2 million years ago) as a result of downwarping associated with regional folding and faulting (Wright and Smith 1992). The watershed is located at the southern end of the northern California Coast Range province. This area is an active zone of tectonic deformation associated with the San Andreas Fault. The San Andreas Fault is located about 35 miles (56 km) southwest of the watershed. The local deformation zone is bounded by two major faults: the north-west striking Green Valley Fault in the east (about 7 miles [11 km] to the northeast of the watershed boundary), and northwest striking Healdsburg-Rodgers Fault in the west (about 15 miles [24 km] to the southwest of the watershed boundary). Both of these faults have experienced major earthquakes in the last 100 years (Eberhart-Phillips 1988, Burcham and Van Houten 1992).
Physical Processes
Aerial photographs taken in the 1940s show the mainstem Napa River valley fully developed into agriculture. At this time, the mainstem Napa River, above the city of Napa was a low gradient, gravel-bedded stream exhibiting bar-pool morphology, with point bars, mid-channel or island bars and multiple channels in the unconfined reaches. These reaches were bordered by floodplains that appeared to be inundated annually with well-established vegetation. There were well-developed wetlands located in the transitional areas between alluvial fans and the valley floor, and on the floodplains. In confined reaches, the Napa River was a single-thread channel with the extent of the active floodplain generally constrained by coarse-textured, erosion resistant tributary alluvial fans.
Prior to major anthropogenic disturbances in the basin, the Napa River would have had numerous side channels that provided backwater rearing habitat for salmonids. The mainstem channel would have been connected to its floodplain in most locations, with the floodplain inundated during several storms per year. In contrast, 1998 aerial photographs depict a simplified riverfloodplain system in which the channel has narrowed, incised, and largely abandoned its former floodplain, resulting in a loss of backwater rearing habitat. Review of channel cross-section records, published reports, and recent field observations indicate that the river has incised at least 4–6 ft (1.2–1.8 m) on average from the mouth of the river to a point upstream of Calistoga, and is currently in the process of active channel incision upstream of Calistoga. Figure 6-1 illustrates some of the changes that occurred between 1940 and 1998 in three reaches. The abandonment of the floodplain and the present-day channel entrenchment are most likely caused by anthropogenic impacts, such as draining and diking of the valley floor, filling of side channels to facilitate development of the floodplain, mainstem channel straightening, mainstem bank stabilization, levee construction, gravel dredging downstream of the City of Napa, gravel bar skimming, loss of bedload supply due to dam construction, and large woody debris (LWD) removal on the mainstem.
These types of alterations of the mainstem river appear to have generally occurred throughout the valley floor, from Calistoga downstream to the City of Napa. Our interpretations of aerial photographs are supported by observations made during surveys of mainstem reaches (approximately 10 miles [16 km], reaches are shown in Map 9), and data from previously published studies. These alterations to the mainstem have affected the quality and abundance of suitable aquatic and riparian habitat for native species. The natural bar-pool morphology evident in the 1940s aerial photos and expected in a wandering river such as the Napa River, with its alternating sequence of pools and riffles, has been converted in many reaches into a series of long run-pools (i.e., long pools that are shallow relative to their length) separated by very small bars. These long run-pools create lake-like habitat for non-native predator fish, increasing the exposure of native salmonids to predation during rearing and outmigration.
Some pool filling by fine sediment was noted in the long run-pool habitats. Channel incision may have increased bed mobilization, which in turn may have increased frequency and intensity of scour of salmonid redds during the winter months (see Section 6.2). Floodplain abandonment has resulted in the loss of side channel, backwater, and slough habitats that would have provided high quality rearing habitat. Throughout most of its length, the mainstem Napa River now has only a narrow band of riparian vegetation.
Geomorphic Processes
Based on review of available geologic maps and literature, the modern topography, including the formation of large tributary fans and the valley floor, is the result of erosion and deposition that has occurred since the mid-Pleistocene or roughly within the past one million years (Kunkel and Upson 1960, Johnson 1977). The elevations of surrounding peaks range between less than 1,000 (300 m) to more than 4,000 feet (1,200 m). Many isolated small hills also protrude from the valley floor now and are composed of rock types that are similar to those in the adjacent mountain fronts. The elevation of the valley floor drops from about 340 feet (104 m) near Calistoga to about 50 feet (15 m) near Napa.
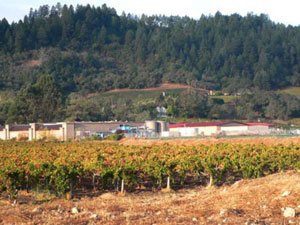
The extent and location of geologic units presented in Table 3-3 and Map 3 are derived from the State of California Geologic Map (1:750,000 scale). The Napa Valley makes up about 28 percent of the watershed area, and is underlain by Quaternary alluvial fan and valley fill deposits (Q, Map 3, Table 3-3). The uplands are composed of Jurassic to Tertiary age volcanic and sedimentary rocks. Approximately 27 percent of the Napa River watershed is underlain by Tertiary volcanic flow rocks (Tv, Map 3, Table 3-3). These volcanics are primarily located in the eastern and northwestern portions of the watershed (Map 3). Jurassic and Cretaceous Franciscan rocks and Cretaceous marine sediments form the bedrock in the western, northeastern, and southeastern portions of the watershed. About 9 percent of bedrock geology in the watershed is underlain by the Cretaceous and Jurassic Franciscan complex rocks (KJf, KJfm), while 13 percent of the watershed is made up of the Cretaceous marine sediments (K, Ku, Kl). The uplands in the northern portion of the watershed are mostly composed of soft Tertiary pyroclastic and volcanic mudflow deposits (Tvp, Map 3, Table 3-3), which make up approximately 8.5 percent of the watershed area. The remainder of the bedrock units is shown on Map 3 and Table 3-3.
A major land use in Napa County, particularly in the Putah and Suisun Creek Watersheds, is livestock grazing. Grazing takes place primarily on open grasslands, but also on oak woo
dlands and shrublands that provide grasses, forbs, or shrubs suitable for browsing animals. With a continually growing population and changing agricultural economy, grazing land acreage in the County has declined from about 200,000 acres in 1960 to approximately 95,000 in 2003. Despite the decline, livestock grazing still remains the largest agricultural land use, in terms of acreage, in the Napa County’s watersheds.
Managing grazing lands properly is critical to watershed protection. Livestock grazing, if not well-managed, can negatively impact our watersheds. Poor management can lead to increased soil compaction and erosion, decreased water quality, damage to native plant species, and loss of wildlife habitat such as riparian corridors. Livestock managers are implementing grazing management systems at a watershed level to help protect water quality, soil integrity, and wildlife habitat. These integrated livestock management systems balance forage production with desired animal impacts to protect the integrity of the natural system of grass, trees, soil and water.
Controlling or eliminating livestock access to streamside areas is important for protecting water quality and riparian habitat. Practices include installing fences to exclude livestock from the riparian corridor and providing off-stream watering sites. Implementing rotational grazing practices and managing noxious weeds is critical to critical to sustaining grassland productivity and controlling erosion. Thistles, goatgrass, tarweed and other non-native species of plants compete with native species for water, soil, and space. Adoption of a range rejuvenation program, followed by well planned range management, helps to control these unwanted invaders.
Source: Napa County Resource Conservation District
Photo: Todd Adams
PHYSIOGRAPHY
This chapter describes in detail the geological resources found in Napa County. Eleven distinct and diverse geomorphic provinces are recognized in California. Each province displays unique, defining features based on geology, faults, topographic relief, and climate. Napa County is located in the Coast Ranges geomorphic province. This province is bounded on the west by the Pacific Ocean and on the east by the Great Valley geomorphic province. The Coast Ranges province extends several hundred miles northward from southern California to near the Oregon border.
A conspicuous characteristic of this province, including Napa County, is the general northwest-southeast orientation of physiographic features such as valleys and ridgelines. In Napa County, located in the eastern central section of the province, this trend consists of a series of long, linear, major and lesser valleys, separated by steep, rugged ridge and hill systems of moderate relief that have been deeply incised by their drainage systems. This physiography has influenced the local climate (creating several microclimates), the development of soils, and the existence and location of geologic hazards such as landsliding. The combination of physiography, soils, and climate has helped give rise to the production of premium wine grapes and other agricultural products for which Napa County is famous.
BEDROCK FORMATIONS AND GEOLOGIC STRUCTURE
Principal rock units of Napa County involve two key components: (1) an older set of rocks composed of accreted, highly deformed terranes that have been displaced—from hundreds to thousands of kilometers from their position of origin—by plate tectonics (at least in part); and (2) a younger, less deformed set of rocks—lying roughly in their original position (except for San Andreas fault system offsets and smaller localized dislocations)—that overlie the accreted terranes.
The structural geology of the County, like in all of the Coast Ranges, is complex and continues to evolve due to broadly influencing regional forces that act along the North American and East Pacific plate boundary. However, the current governing processes are consistent with events since the Pliocene (about 5–2 million years ago) and Quaternary (last 2 million years), which superimposed compressional deformation on earlier extensional deformation.
UNCONSOLIDATED SURFICIAL DEPOSITS
Unconsolidated surficial soil deposits (clay, silt, sand, gravel, and organic material) in Napa County are geologically young materials lying on bedrock at or near the Earth’s surface. They are typically the product of weathering from bedrock formations and have subsequently been transported and deposited by gravity, sheetwash, streamflow, wind, or other processes. Relative to the underlying bedrock, these deposits are most often loose, weak, and soft, and therefore more susceptible to erosion and landsliding. The soil horizons that have developed on the uppermost part of many of these deposits provide the medium for agriculture, including the County’s valuable vineyard lands.
SEISMICITY
Structural damage from seismic shaking should be anticipated in the County sometime within the next few decades. Older, unreinforced masonry buildings and other buildings constructed before 1930 that have not been seismically retrofitted are most subject to structural failure or collapse.
The chance for a magnitude 6.7 or larger earthquake to occur in the Bay Area by the year 2032 is 62%. Smaller earthquakes (between magnitudes 6.0 and 6.7), capable of considerable damage depending on proximity to urban areas, have about an 80% chance of occurring in the Bay Area by 2032 (U.S. Geological Survey 2003). Depending on the proximity to the County and magnitude of the earthquake, damage could range from nominal to high. Scenarios have been prepared to estimate future earthquake shaking damage in the ten Bay Area counties. Depending on the magnitude considered in the scenario, the estimated damage to buildings in the County could range from $10–$300 million. Most of this damage would be in the southern, more populated part of the County, especially in the deeper alluvium of the lower Napa Valley, which is more susceptible to amplified seismic shaking. It is anticipated that earthquakes on the much longer active and potentially more damaging faults located throughout the Bay Area would result in more groundshaking damage in the County than earthquakes on the shorter active faults within the County.
GEOLOGIC AND SEISMIC HAZARDS
Landsliding, common to the entire Bay Area, is the most potentially damaging geologic hazard in the County. Though often referred to as “mudslides” these more rapid flows may carry various mixtures of debris including boulder to cobble-sized rock fragments, sand, silt, mud, and organic materials. All of the principal ridge and hill systems in the County have experienced at least some landsliding.
| Landsliding is the most potentially damaging geologic hazard in Napa County. Landslide hazards can be reduced by proper land use planning. |
Most landslides present the risk of property damage. Rapidly moving slides such as debris flows and debris avalanches also present the risk of injury and death. Landslide hazards can be reduced by proper land use planning that includes identification of hazard, followed by avoidance measures, or corrective measures.
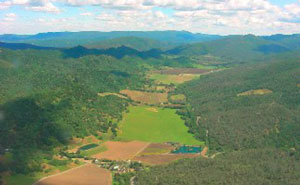 Aerial view of Chiles Valley, Napa County |
Surface fault rupture also presents a hazard. The highest potential for surface fault rupture is along the three known active faults in the County: West Napa fault, along the west side of Napa Valley; Green Valley fault, in the southeastern part of the County, and Hunting Creek fault, in the northeastern part of the County. These faults are zoned for special investigation according to the provisions of the Alquist- Priolo Earthquake Fault Zoning Act; human habitation structures cannot generally be built across them.
Ground shaking as a result of future earthquakes, common to other areas of the seismically active San Francisco Bay region, is likely on the three known active faults in the County. The intensity of earthquake motion at the site will depend on the characteristics of the generating fault, distance to the epicenter, the magnitude and duration of the earthquake, and specific geologic conditions. Portions of the County that are underlain by thicker soil deposits could experience slighter ground amplification during seismic activity than upland areas with very shallow bedrock. Severe ground shaking could also trigger secondary effects such as localized failure of slopes and compaction of settlement of loose fills.
Liquefaction refers to the sudden, temporary loss of soil strength during ground shaking. This phenomenon can occur where there is a unique combination of conditions, i.e., clean, saturated, loose granular deposits within depths of about 20–50 feet. Young alluvial soils (geologic map symbols Qhc, Qhay, Qhty, Qha, Qht, Qhf, Qa, Qt, and Qf) are the geologic deposits most likely to contain soils susceptible to liquefaction. The location of these deposits varies widely across the County.
Lateral spreading can occur during strong ground shaking. Lateral spreading generally occurs on slopes and near the tops of slopes where stiff soils are underlain by soft liquefiable deposits. Areas susceptible to lateral spreading are the younger alluvial areas adjacent to the Napa River or other incised rivers within the County.
Lurching and associated ground cracking is generally confined to areas underlain by soft deposits, which are also bordered by steep channel banks or by adjacent hard ground. Areas most susceptible are former and current marsh areas (geologic map symbols Qhbm, Qaf/Qhbm, Qhb) located at the southern end of the County.
Expansive soils and accelerated erosion (such as minor rutting and rilling to extensive gullying) are present at many locations throughout the County. While landslides are generally restricted to hillside areas, the base of slopes, and along steep stream banks, expansive soils and accelerated erosion can occur on both hills and more gently sloping valley areas. While these hazards do not present as high a risk as landsliding, they can be damaging to some kinds of land uses and associated improvements. Geotechnical measures are available to correct expansive soil problems, and accelerated erosion can be avoided by proper erosion control measures.
Subsidence and settlement result from the same physical processes. Subsidence takes place over a long time frame and broad regional area; settlement is usually considered to occur within a relatively short time frame and within a small area, for instance on the project scale. Subsidence/settlement can occur differentially; that is, one area or location subsides or settles more than another. The results of subsidence/settlement, especially when it occurs differentially, can be quite damaging.
Seiches and tsunamis pose a low potential for damage, due to lack of bay front exposure within the County. Some potential may exist for seiche within large bodies of water in the County, such as reservoirs. While presumably low, the risk has apparently not been evaluated. To evaluate seiche risk within large storage tanks requires a site-specific investigation.
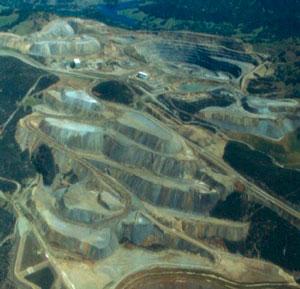
Former Homestake Mine, Napa County
Various mineral resources have been mined in Napa County. Mercury and mineral water were the most valuable mineral resources historically. Today, because of growing development, building stone and aggregate are the most valuable commodities.
Historically, various mineral resources have been mined in Napa County. The two most valuable mineral commodities in economic terms have historically been mercury, or quicksilver, and mineral water. More recently, building stone and aggregate have been the most economically valuable mineral commodities in the County. This reflects the growing need over recent decades for construction materials as the population of the region grows.
The principal regulatory document pertaining directly to mining and mining reclamation in California is the Surface Mining and Reclamation Act (SMARA) of 1975 (Chapter 9, Division 2, of the Public Resource Code). Napa County is the lead agency for implementing the requirements of SMARA. Special Report 146, prepared under the authority of SMARA, focused on classifying land in the San Francisco-Monterey Bay region, including Napa County, into mineral resource zones (MRZs) based on guidelines adopted by the California State Mining and Geology Board. Areas were zoned MRZs if they were identified as being within areas subject to urbanization. This classification project has been designed to assist and guide local lead agencies, such as Napa County, in preserving essential mineral resources for future use through proper zoning ordinances. Three principal MRZs were identified in Napa County, although MRZ maps were not prepared for the entire County.
There are currently four active mines (rock quarries) in Napa County, two of which are not presently being mined but only serve as mineral storage areas. These quarries produce construction materials. The only significant mine currently in operation in Napa County is Napa Quarry.
The principal constraints to future mining operations in Napa County relate to permitting, economics, the environment, and politics. The geologic opportunities for future mineral extraction in Napa County are not clearly known because the County has not been fully mapped for MRZ zones. However, the general geology of the County suggests that the potential for favorable aggregate rock does exist.
Countywide emissions of the following criteria pollutants were assessed in the BDR:
- Ozone (O3)
- Carbon monoxide (CO)
- Oxides of nitrogen (NOX)
- Sulfur dioxide (SO2)
- Particulate matter 10 and 2.5 microns or less in diameter (PM10 and PM2.5, respectively)
- Lead (PB)
Carbon monoxide modeling was performed for roadway segments with high daily traffic volumes using traffic data prepared by the project traffic engineers, Fehr & Peers. Regional climate and meteorology conditions were assessed, and precipitation patters were mapped. In addition, sensitive receptors and land uses were identified.
The existing air quality conditions in the County were characterized by assessing monitoring data collected for the region at the Jefferson Avenue monitoring station in the City of Napa. Air quality conditions within the County are such that it is listed as a non-attainment/maintenance area for several pollutants. It was determined that the Jefferson Avenue monitoring station has experienced three violations of the state 1-hour ozone standard; 24.4 violations of the state 24-hour PM10 standard; and no violations of the federal and state CO standard, federal 1-hour ozone standard, federal 8-hour ozone standard, and federal PM10 standard during the last 3 years for which complete data are available. PM2.5 is not monitored in Napa County. The U.S. Environmental Protection Agency (EPA) has classified Napa County as a nonattainment (other) “not classified/moderate” area, with a 2006 attainment deadline, for the 1-hour ozone standard, and a marginal nonattainment area for the 8-hour ozone standard. For the CO standard, the study area is classified as a moderate (≤ 12.7 ppm) maintenance area, while the rest of the County is classified as an unclassified/attainment area. The EPA has classified the County as an unclassified/attainment area for the PM10 and PM2.5 standards. The California Air Resources Board (ARB) has classified the County as a serious nonattainment area for the 1-hour ozone standard, and an attainment area for the CO standard. The ARB has classified the County as a nonattainment area for the PM10 and PM2.5 standards.
Although the County is designated as a non-attainment/maintenance area for several pollutants, monitoring data suggests that few violations of the NAAQS and CAAQS have occurred in the last few years, and air quality has been improving. Due to the relatively rural/agrarian nature of the County, it has relatively few traditional industrial/commercial sources of pollutants, and data from the ARB suggest that transport of some pollutants into the SFBAAB from neighboring air basins can adversely affect air quality within the County. Further, the bowl-shaped valley may also help to trap pollutants within the County.
The BDR divided Napa County into thirteen evaluation areas to facilitate the analysis of biological resources and management concerns in distinct regions of the County. Common and sensitive biological communities, wildlife movement, concentrations of valuable biological resources, fire ecology, and management concerns are discussed for each of the evaluation areas.
REGIONAL CONTEXT
California is considered a global “hot spot” for biological diversity, where species diversity, endemism, and threats to this diversity are all particularly high (Myers et al. 2000, Stein et al. 2000). California contains more native biological diversity than any other state, including more endemic species than any other state (1,295 species) (Stein 2002). Threats to this biological diversity are also high relative to the rest of the U.S. Napa County is located within the California Floristic Province, the portion of the state west of the Sierra Crest that is known to be particularly rich in endemic plant species (Hickman 1993, Stein et al. 2000).
COUNTYWIDE CONTEXT
Napa County has a high natural level of biodiversity compared to California as a whole. The County’s biodiversity provides valuable goods, services, and scientific information. More importantly, the plants and animals of the County provide many critical ecological and social functions. Napa County’s many species also represent a vast storehouse of scientific information, most of it unexplored and some of it endemic to the County.
The following are critical issues of concern for protecting biodiversity in the County.
- Planning and/or limiting development to avoid or minimize impacts on sensitive communities, special-status species, and wildlife movement between large and/or critical natural areas
- Protecting and enhancing the Napa River, Putah Creek, and the other streams in the County
- Controlling the spread of invasive exotic species
- Preventing type conversion of biotic communities through changes in natural disturbance regimes, such as fire and flooding
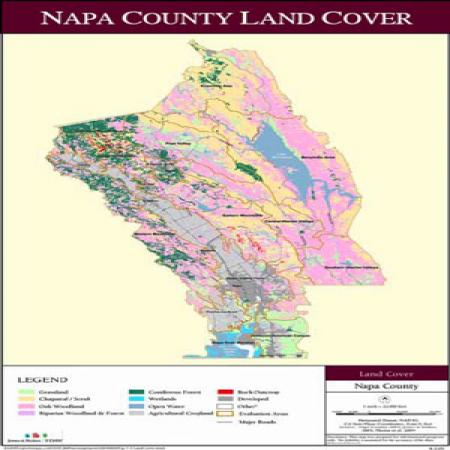
BIOTIC COMMUNITIES
 California contains more native biological diversity than any other state. Napa County has a high natural level of biodiversity compared to California as a whole. |
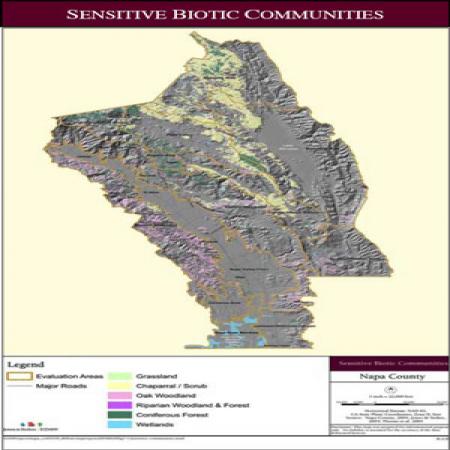
Ten general land cover types have been identified in Napa County: grassland, chaparral/scrub, oak woodland, riparian woodland and forest, coniferous forest, wetlands, open water, rock outcrop, agricultural cropland, and developed lands. Of these ten, all except for two—rock outcrop and developed lands—are considered biotic communities. Dominant plants, general distribution, common wildlife, and special-status species for specific biotic communities within each of these general communities are described in the body of the biological resources chapter of the BDR.
The California Department of Fish and Game (DFG) recognizes 21 sensitive biotic communities in the County, not all of which are mapped. Many of these communities are subtypes of the general biotic communities described above. An additional six communities are considered sensitive because they are locally rare. Sensitive communities in the County include native grassland, serpentine chaparral, riparian forest, and cypress woodland. Six communities of limited distribution have been identified on a countywide scale: redwood forest, wet meadows, mudflats, Brewer willow scrub, ponderosa pine forest, and tanbark oak forest. Of these six communities, redwood forest is also recognized by DFG as potentially sensitive.
Several biotic communities are considered important to protect because of their relatively limited extent in the County and their importance to a large number of special-status plant and/or wildlife species. These communities are riparian woodland, freshwater wetlands, salt marsh, serpentine grassland, and streams, which are critical for the County’s special-status plant and wildlife species. Rock outcrops are critical habitat features used by special-status plants and wildlife.
SPECIAL-STATUS PLANTS & WILDLIFE
Eighty-one special-status plant species occur or potentially occur in Napa County. Their distributions and habitat associations are summarized in the biological resources chapter of the BDR. Particular biotic communities, such as serpentine grasslands, are shown to have high importance to specialstatus plant species relative to their extent in the County.
Sixty special-status terrestrial wildlife species and 9 special-status fish species occur or potentially occur in the County. Associations of these species with particular biotic communities are discussed in the chapter, which highlights the importance of a few communities, such as salt marsh and riparian woodland. A detailed analysis of streams and the riparian corridors is also provided, including a discussion of which stream channels are supportive of sensitive fish species.
WILDLIFE MOVEMENT AREAS
Three major, regional north-south wildlife movement routes have been identified in Napa County: the Western Mountains, the Napa River, and the Blue Ridge-Berryessa Natural Area. Constraints to eastwest movement and the importance of riparian corridors are discussed in the BDR, as is the potential for zoning buildout to constrain wildlife movement in particular parts of the County. Maintenance of wildlife movement areas is important to conserve the diversity of wildlife and plants within Napa County.
The purpose of the energy resources chapter of the Baseline Data Report is to discuss historical, existing, and projected electricity and natural gas production, consumption, and peak demand in the County. Gasoline consumption by vehicles in the County is also discussed.
 Countywide Natural Gas Consumption (2003) by sector |
In this chapter, the County is assessed as a single region rather than divided into evaluation areas due to data limitations. The primary sources for information in this energy chapter are Pacific Gas and Electric Company (PG&E) and the California Energy Commission (CEC). The CEC provided GIS maps of major electrical transmission lines and natural gas pipelines in the County as well as estimates of electricity and natural gas consumption rates for the entire County for the years 1990–2003. PG&E provided estimates of transmission capacity and system upgrades. Vehicular energy consumption is based on Caltrans’ California Motor Vehicle Stock, Travel, and Fuel Forecast reports, which project vehicle fuel consumption in gallons (Caltrans 2004). Vehicular fuel consumption estimates utilize longterm projections of statewide population, economic growth (total personal income), fuel prices, inflation, and interest rates to estimate gallons of gasoline and diesel consumed per County.
ELECTRICITY
In the County, PG&E is the main energy utility provider for all sectors of the community. There are six energy-producing facilities in the County, providing a total capacity of 20.06 megawatts (MW). This was sufficient to supply approximately 8.5% of the County’s peak electrical demand for 2004. Small-scale, private energy generation by solar, wind, and biogas is also on the rise throughout the County, particularly in association with wineries.
Total electricity consumption in 2003 in Napa County was 512.5 thousand barrel of oil equivalents (BOEs), compared to 365 thousand BOEs in 1990 (i.e., 40% greater in 2003). Per capita use increased at a much slower rate during the same time period (1.2% per year on the average), to 2.89 BOEs in 2003. However, total energy consumption peaked in 2000 at 540.8 BOEs. This peak, and subsequent decline, is attributed to fluctuations in the mining and commercial sectors. In 1990, electricity consumption by mining operations accounted for 0.5% of the total energy delivered to the County. Seven years later, in 1997, mining accounted for over 9% of total consumption in the County. This fluctuation represents an increase of over 2,400%. Increases in the consumption by the mining industry, combined with a consumption peak within the commercial industry, led to an overall energy consumption peak in 2000.
Napa County Per Capita and Total Electricity Consumption
|
Year
|
Per Capita Electricity Consumption | Total Electricity Consumption |
|
1990
|
3.30 BOE | 365.4 thousand BOE |
|
2000
|
4.35 BOE | 540.8 thousand BOE |
|
2003
|
3.89 BOE | 512.5 thousand BOE |
The residential sector is by far the largest consumer of natural gas in the County, accounting for 44% of the Countywide annual consumption in 2003. The commercial sector is the second largest consumer of electricity, accounting for 32% of consumption in that same year. The industrial sector was a distant third, accounting for 16%. The remaining sectors—transportation, communication and utilities [TCU]; mining; and agriculture—each accounted for less than 8% of the total electricity consumed. Trends in peak electricity demand in the County are similar to those discussed for total annual energy consumption. Peak demand over the 13-year period has increased 38% (approximately 2.5% per year on average) to 105.1 BOE in 2003. Per capita peak demand, on the other hand, has actually decreased 16% overall or 1.1% per year on average. There are three major electrical transmission routes that cross from east to west through the County, and nine electrical substations in the County, all owned by PG&E.
NATURAL GAS
There are no natural gas production wells in Napa County (CEC 2004). Between 1990 and 2003, annual energy consumption as natural gas has been consistently higher than annual energy consumption as electricity, but the difference has been steadily decreasing. While electricity demand has grown, natural gas demand has remained relatively constant. In 2003, total natural gas use was at 663 thousand BOEs, compared to 669 thousand BOEs in 1990. Per capita natural gas use has actually dropped 1.4% per year on the average over this period to 5.04 BOEs in 2003.
Napa County Per Capita and Total Natural Gas Consumption
|
Year
|
Per Capita Natural Gas Consumption | Total Natural Gas Consumption |
|
1990
|
6.04 BOE | 668.79 thousand BOE |
|
2000
|
5.57 BOE | 691.77 thousand BOE |
|
2003
|
4.04 BOE | 663.65 thousand BOE |
The residential sector is by far the largest consumer of natural gas in the County, accounting for 58% of the countywide annual consumption in 2003. The commercial sector is the second largest consumer of natural gas, accounting for 28% of consumption in that same year. The industrial sector accounted for 13%, and the TCU, mining, and agriculture sectors combined accounted for less than 1% of the total natural gas consumption in 2003.
PG&E designs gas facilities to ensure reliable gas service to core customers on an “abnormal peak day” (APD). The expected APD gas daily demand for Napa County in 2004 was 36,890 thousand square feet (mcf) (378,860.3 therms). The current transmission capacity is above this peak demand.
PG&E predicts that there will be no gas transmission capacity constraints in Napa County within the next 5 years. Currently, PG&E reviews capacity in 5-year periods; however, it plans to begin projecting transmission demand for 10-year periods. The manager of Transmission System Planning (PG&E) believes that current transmission capacity may last past the project 5-year period. The last gas transmission upgrade in Napa County was performed in 2004 in the St. Helena/Calistoga/Angwin area. No upgrades are planned to the Napa County gas transmission system in the next 5 years.
GASOLINE
Between 1993 and 2003, annual gasoline consumption in Napa County increased nearly 27%, or 2.4% per year, to 61.935 million gallons in 2003. Per capita use also increased but by a smaller amount (just under 11%). This is expected because a portion of the increase in overall use appears to be related to increased tourist travel in the Napa Valley. This conclusion is supported by the fact that the average annual per capita gasoline consumption for Napa County in 2003 (470.09 gallons per capita) is 9.3% (almost 44 gallons) higher than the average for California as a whole.
This chapter of the BDR discusses the federal, state, and local policies that govern environmental noise in Napa County (County), describes the methods used to quantify noise conditions in the County and identifies noisesensitive land uses and major noise sources, as well as existing noise conditions.
The County’s currently adopted Noise Element (amended on August 1, 1990, and reformatted in December 1996) and the County’s noise ordinance establishes policies and regulations concerning the generation and control of noise that could adversely affect its citizens and noise-sensitive land uses. The County has established guidelines to assist in determining compatibility with surrounding land uses.
General noise practice identifies noise-sensitive land uses as being land uses where noise can adversely affect use of the land. These are often places where people live, sleep, recreate, worship, and study; they are generally considered sensitive to noise because intrusive noises can be disruptive to these activities. Such land uses were identified and mapped in the County. In addition, primary sources of noise were identified in the County. The dominant sources of noise in the County are related to transportation and include automobile and truck traffic, aircraft, and trains. Stationary sources are also present in the County, and they include construction sites, agricultural activities, and commercial and industrial facilities.
 I-80, SR 12, SR 9, SR 121, SR 128, and Silverado Trail are sources of traffic noise in Napa County. |
Noise levels produced by traffic on state highways and county roads with more than 3,000 vehicles per day were calculated using the FHWA Traffic Noise Prediction Model. Aircraft operations were also assessed, as was train activity, although no active freight rail lines are in operation within the County. Noise from construction, agricultural, commercial, and industrial facilities was also quantified, based on information from short- and long-term noise monitoring locations. The County, in consultation with consulting experts, identified all short- and long-term monitoring locations. The noise metric used is day-night noise level (Ldn) and equivalent sound level (Leq).
Contours for existing noise conditions were mapped based on results from the monitoring study described above, as well as on noise modeling and information from previous studies.
In general, it was determined that there are very few existing noise conflicts within the County. A key indicator of noise conflicts is the number of complaints registered with the County. Data provided by the County sheriff’s department indicate that there were few noise complaints received for the years 2003 and 2004.
This chapter of the BDR describes the methods used to analyze hazard potential for human-made hazards, including vehicular accidents, crime, and hazardous materials spills; as well as natural hazards, including seismically related hazards, wildland fires, and flooding.
HUMAN-MADE HAZARDS
Traffic
To assess traffic hazards, five law enforcement agencies, including the California Highway Patrol, were contacted. Napa County is below average compared to adjoining counties in the total numbers of persons killed and injured from auto and motorcycle accidents. From 1993 to 2003, the total number of accidents in Napa County has increased by 30%. The City of Napa experienced approximately 60% of the total accidents in the County in 2003, although only 1 of the 20 deaths occurred in the City. Overall, the total number of traffic accident-related deaths within the County remained relatively constant from 1993 to 2003 despite increases in population; this may be due in part to safer vehicles and improved enforcement of seatbelt laws.
Crime
The Office of the Attorney General at the California Department of Justice (CDJ) and the Napa County Sheriff’s Department were contacted to collect information on crime rates and trends. Napa County has a lower crime rate than the state as a whole. Solano, Yolo, and Lake Counties report higher crime rates than Napa County, but Napa County reported more incidents of crime than Sonoma and Marin Counties. From 1993 to 2003, the total reported crimes (per 100,000 people) in Napa County decreased 27%, from 4,230 to 3,074 (CDJ 2004). The highest population-adjusted crime rate occurred in the year 1994 and the lowest in 2000.
Reported crimes fall into four general categories: violent crimes (homicide, rape, robbery, and aggravated assault); property crimes (burglary and motor vehicle theft); larceny/theft; and arson. Larceny/theft is the most common type of reported crime in Napa County, followed by property crimes, violent crimes, and arson. Of the four types of violent crimes, aggravated assault is the most prevalent.
Hazardous and Contaminated Sites
 |
Napa County is known for its agricultural production. Due to the use of fuel, pesticides, and other chemicals, agricultural production is a major source of hazardous wastes and contaminated sites. However, due to increasing population in all Bay Area counties, including Napa, hazardous materials are also becoming more widely used throughout the urban centers, including in Napa County. Potential human exposure, magnitude of risk associated with contaminated sites, chemical spills, and polluted groundwater within Napa County are all public health and safety issues. Existing data provided by Napa County regarding hazardous sites included contaminated site listings from the many databases identified in this chapter. The database search described in the methods section identified hundreds of sites, each with varying levels of information and detail. From this information, a hazardous sites map was developed and divides the hazardous site locations into four different classes (red, orange, yellow, and white) based on the potential risk to human health.
NATURAL HAZARDS
Earthquakes, Seismicity, and Other Geologic Hazards
Napa County, similar to the San Francisco Bay region, is subject to primary and secondary seismic hazards (resulting from earthquake activity) and other non-seismic geologic hazards. As stated in the geological resources chapter, a number of faults have been mapped within the County, but only three have been designated active by the California Geological Survey in accordance with the Alquist Priolo Earthquake Fault Zoning Act. The primary seismic hazard generated from earthquakes on these faults is surface rupture. Secondary seismically induced hazards, which could be generated from faults within the County or regionally, include groundshaking, landslides, liquefaction, lateral spreading, lurching, differential settlement, and failure of levees and dams.
Non-seismically induced geologic hazards include ground subsidence/settlement, landslides and soil creep, and erosion. These hazards have the potential to cause injury to people or damage to property. GIS maps created for these hazards are provided in this chapter to identify the potential for occurrence in the County.
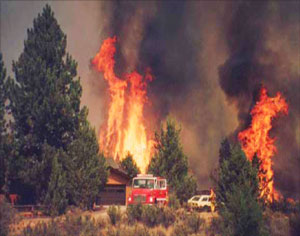
Fire Hazard Severity
Most of Northern California, with its cool wet winters and long dry summers, is considered a high fire hazard environment. Wildfire is a natural and integral component of California’s landscape that has sculpted the geology, soil, and vegetation of the region. Napa County is characterized by narrow valley floors surrounded by steep, hilly terrain and fire-evolved vegetation, which, combined with the plentiful wildland recreational opportunities, leads to the high wildland fire rates experienced in the County.
Wildland fires are so frequent that in the last 30 years wildfires have burned 232,000 acres of land in or directly adjacent to Napa County, a county of approximately 482,000 acres.
Fire hazard zoning is one of the first steps in comprehensive land use planning. To determine the fire hazard severity in the County, a GIS-based model was developed. This model uses digital mapping of parameters that affect wildfire hazards such as landscape characteristics, historical data, weather, and structural value, to rank areas within the County from low to high on a fire hazard severity scale. The model analyzed and ranked the risk, hazard, and value for each evaluation area. Based on results of the model, Napa County has 47,441 acres of severe high fire hazard land, which represents about 10% of the County. The Napa Valley floor, eastern mountains and Cameros areas, which comprise 16,358, 12,645, and 3,587 acres respectively, had the greatest amount of high fire hazard severity land. The Angwin area has the highest percentage, with 41.8% of its area characterized as high hazard. With 0.72%, the Knoxville area has the lowest percentage of high fire hazard land. The fire hazard severity model and data used will be given to the County upon completion of the BDR analysis, which will allow the California Department of Forestry and Fire (CDF) and Napa County Fire to easily make adjustments when more data become available in the future.
Flooding
Napa County is a flood-prone region because it has a Mediterranean climate of wet winters and dry summers and a landscape of steep hills and a wide valley floor. Recent population and development pressures have also increased the flood hazard potential in the County. The Napa River flows through the Napa Valley Floor past Calistoga, St. Helena, Yountville, and Napa. The City of Napa, located where the Napa River flattens into the San Pablo Bay estuary, is the most flood-prone populated area in the County and the fifth most flood-prone community in California in terms of flood damage payments from the Federal Emergency Management Agency (FEMA). To assess flooding hazards, FEMA flood zone maps for the 100- and 500-year floods were analyzed. Specific areas subject to flooding in City of Napa are generally from Trancas Street in the north to Imola Avenue in the south, Coombs Street to the west and Silverado Trail to the east. Between 1862 and 1997, the City of Napa experienced 27 floods, the largest of which occurred on February 18, 1986 (Wadsworth 1998).
During a 100-year flood, more than 325,000 gallons of floodwater per second would flow through the City of Napa, or five times the volume of Lake Hennessey, over the span of the flood. More than 3,500 people and 2 million square feet of business and office space would be inundated.
Based on the 2000 Census, the total population of Napa County was 124,279, with the majority (78%) living within the five incorporated cities, and 22% living in the unincorporated portion of the County. The City of Napa has the highest population, 72,585 persons (58% of the total County population).
The median household income in Napa County was $51,400, which is 8% higher than the 2000 statewide median. The highest median income in the County was in the unincorporated areas, with a median income of $63,600, and the lowest median income was found in Calistoga, with a median of $39,500.
As of 2004, the labor force in Napa County was 72,400, with a 3.9% unemployment rate. It is estimated that the total farm worker population in Napa County ranges from 2,965 to 6,500, with approximately 12% regular workers, 38% seasonal workers, and 50% harvest-only workers.
GROWTH TRENDS
Between 1990 and 2000, Napa County experienced an approximately 12% increase in overall population and a 10% increase in number of households. The American Canyon area experienced the most rapid population growth, with an approximate 26% increase in this time period. The second most notable population increase occurred in the City of St. Helena, with a 19% increase between 1990 and 2000. Both the Town of Yountville and the unincorporated areas of the County experienced a decrease in total population during this period. The Association of Bay Area Governments (ABAG) projects that populations in Napa County will continue to experience steady growth over the next 25 years. However, the anticipated levels of growth differ greatly between the 12 geographic regions assessed in this chapter. American Canyon is projected to be the most rapidly growing incorporated area, with a projected 61% increase in population over the next 25 years, and an almost doubling in the number of available jobs. Economically, Napa is the second fastest growing city in the County, with the number of jobs projected to increase by 40% by 2030. It also remains the jurisdiction within which the bulk (64%) of the 29,000+ person increase in population is projected to take place. The remaining incorporated areas in the County, St. Helena, Calistoga, and Yountville, seem to have reached their maximum populations with relatively low growth rates projected for the future. Future growth rates in the Town of Yountville and the unincorporated portion of Napa County are expected to be even less significant if they continue to decline.
HOUSING CHARACTERISTICS
As of the 2000 Census, the total number of housing units in Napa County was 48,554, with 45,402 (93.5%) occupied housing units and 3,152 (6.5%) vacant housing units. According to the ABAG Regional Housing Needs Determination, the total housing need in Napa County for 2001 to 2006 is 7,063 units. Each of the Housing Elements for the jurisdictions in Napa County addresses current and future housing needs and future supply of housing stock to meet the projected regional demand. The Housing Elements of the Cities of Yountville, Napa, and Calistoga contain housing objectives that exceed ABAG requirements, raising the programmed amount of new housing in Napa County above ABAG’s projected need. However, available housing is not necessarily affordable for all segments of the population in Napa County.
Housing will continue to remain a critical issue for Napa County over the coming decade. Land availability and housing for lower income levels and special needs groups, such as farm workers, is a current challenge. Housing needs for these population groups will only be met through the implementation of the housing policies and programs set out by each jurisdiction’s Housing Element.
Preservation of agriculture and open space lands is a high priority in Napa County’s current General Plan. According to the data collected through the digital land use database in GIS maintained by the County, Napa County consists of approximately 506,000 acres, 94% of which is unincorporated. The county assessor has designated a large portion of the land within Napa County as Rural Lands (50%); this designation includes non-farming and non-grazing operations such as vineyards, residential parcels larger than 10 acres with residences, and vacant residential parcels larger than 10 acres. Of these Rural Lands, 72% are vacant, largely because of steep terrain, mountain ridges, and narrow valleys. These natural features, in addition to the predominance of agricultural land uses, contribute to the County’s rural character.
 |
Current land use patterns and projected land use trends have been analyzed in the report for twelve land use evaluation areas: Cities of (1) American Canyon, (2) Napa, (3) St. Helena, (4) Calistoga; (5) Town of Yountville; (6) Carneros/Napa River marshes/Jamieson/American Canyon-unincorporated; and (7) Napa Valley floor-unincorporated/western mountains area, (8) Livermore Ranch/Pope Valley/Knoxville area, (9) Angwin area, (10) eastern mountains-unincorporated/central interior valleys area, (11) southern interior valleys, and (12) Berryessa area. In addition, potential land use conflicts are analyzed.
LAND USE DEVELOPMENT PATTERNS
Historically, residential and commercial development in Napa County has generally occurred within the five incorporated areas of the County; unincorporated areas have generally remained predominantly agricultural, rural residential and open space. The County’s current General Plan directs development toward existing incorporated and urban areas. Recent agreements between the County and unincorporated areas allow for incorporated cities to provide the majority of the County’s new housing development. In addition, Measure A, approved in 1980 by voters and extended by the Board of Supervisors in 2004, and Measure J approved in 1990 extending until 2020, both limit the pace of market-rate housing development in the unincorporated County.
The vast majority of growth and development has occurred predominantly within the Cities of Napa and American Canyon, and the City of American Canyon has experienced the most significant growth and land conversion over the past decade. The majority of growth on the Napa Valley floor has also occurred within incorporated areas, particularly in the City of Napa. The Town of Yountville and the City of St. Helena have experienced limited growth. The City of Calistoga has experienced moderate growth in the past decade.
There has been very little development or growth within the unincorporated areas of the County over the past 15 years. In particular, there has been very little commercial development activity in these areas. The Napa County General Plan strongly emphasizes preservation of agriculture and open space resources. Current development patterns within the County are reflective of this, as described below.
- Carneros/Napa River Marshes/Jamieson/American Canyon-Unincorporated Evaluation Area. New development includes small areas of rural low-density residential development just outside the City of American Canyon’s planning area, and a large amount of industrial development between the City of Napa and the City of American Canyon.
- Napa Valley Floor/ Western Mountains Area. Both areas have experienced little or no development. Development of the Napa Valley floor has been primarily new wineries. The western mountains area has seen very limited development.
- Livermore Ranch/Pope Valley/Knoxville Area. This very rural area has seen only minimal recent development.
- Angwin Area. This area has experienced minimal recent development.
- Eastern Mountains-Unincorporated/Central Interior Valleys Area. This area is almost entirely undeveloped, and has remained so over the past decade.
- Southern Interior Valleys. This area does not contain any urban lands and has not undergone any major developments in the past decade.
- Berryessa Area. This area has consisted of mostly rural residential and agricultural land uses over the past decade.
EXISTING LAND USE
Current land use information for this analysis was obtained through the Napa County land use which is based on parcel-level information obtained by the Napa County Assessor’s Office. Assessor’s data differs from other sources and uses definitions that differ from the zoning code definitions used the Napa County Conservation, Development and Planning Department. All data and conclusions presented should be viewed with this in mind.
The following land use categories are based on the existing General Plan land use designations, have been adapted and expanded for use in the BDR to provide an up-to-date and more thorough realistic analysis of the existing land use conditions within Napa County. Land use groups were defined as follows for conversion from Assessor’s Parcel data to the Napa County Land Use Database.
- Commercial
- Parcels or portions of parcels of any size containing commercial uses including retail sales, offices and motels/ B&Bs as identified by the Napa Co Assessor
- Vacant commercial parcels of any size as identified by the Napa Co Assessor
- Parcels of any size containing commercial recreational uses
- Industrial
- Parcels of any size containing industrial uses including warehousing as identified by the Napa Co Assessor
- Parcels of any size in industrial areas containing wineries with approved production capacities of 25,000 gallons/yr or greater
- Vacant industrial parcels of any size as identified by the Napa Co Assessor
- Public/Quasi-Public
- Parcels of any size containing schools (both public and private), colleges, churches, railroads, substations, water treatment plants, water tanks, sewage treatment facilities, airports, etc as identified by the Napa Co Assessor
- Vacant public/quasi-public parcels of any size as identified by the Napa Co Assessor
- Parks and Open Space
- Publicly owned parcels of any size identified by Napa Co Assessor and the Land Trust of Napa County not committed to some other form of developed public use
- Urban/Suburban Residential
- Residential parcels < 2 acres in size
- Vacant residential parcels < 2 acres in size as identified by the Napa Co Assessor
- Parcels < 2 acres in size with vineyard, orchard, and/or grazing use only
- High-density residential parcels of any size as identified by the Napa Co Assessor
- Vacant high density residential parcels of any size as identified by the Napa Co Assessor
- 14 vacant high density affordable housing sites [per County ordinance #1246, establishing the AH affordable housing combination district, governed under Chapter 18.82 in the Napa County Code]
- Rural Residential
- Residential parcels 2 to 10 acres in size
- Vacant residential parcels 2 to 10 acres in size as identified by the Napa Co Assessor
- Parcels 2 to 10 acres in size with vineyard, orchard, and/or grazing only
- Rural Lands
- Non-farm and non-grazing land portions of parcels >10 acres in size that contain one or more residences and/or a winery
- Vacant residential parcels >10 acres in size as identified by the Napa Co Assessor
- Parcels >10 acres in size with secondary vineyard, orchard, and/or grazing use
- Portions of 10-acre and larger parcels with secondary vineyard, orchard, and/or grazing use
- Farming
- Parcels or portions of parcels containing vineyards and/or orchards totaling together 10 acres or more in extent
- Parcels outside urban/suburban residential, commercial and industrial areas containing wineries with approved production capacities of 25,000 gallons/yr or greater
- Parcels or portions of parcels containing 10 acres or more of unplanted potential vineyard
- Grazing
- 40-acre and larger parcels or portions being grazed under Williamson Act Contract or as identified by the County Agricultural Commissioner’s Office
The table below provides a detailed land use breakdown for unincorporated areas. It includes a breakdown of land uses by land use category, and treats separately land that is currently developed from and land that is designated in that category but is currently vacant/ undeveloped. It is important to note that the Napa County GIS does not contain detailed land use information for areas within the five incorporated cities/towns within Napa County. Since data for the incorporated areas of the County is not available through the County’s GIS, data for these areas were collected through contacting city/town planning departments and using information from each incorporated area’s General Plan.
Napa County Land Use Summary (Unincorporated Areas)
|
Land Use Category
|
Existing / Developed Acres | % of Total | Designated / Vacant Acres | % of Total | Total Acreage | % of Total |
| Commercial | 2,374 | 0.5% | 814 | 0.2% | 3,188 | 0.6% |
| Industrial | 1,474 | 0.3% | 1,474 | 0.3% | 2,948 | 0.6% |
| Public / Quasi-public | 6,645 | 1.3% | 208 | 0.0% | 6,850 | 1.4% |
| Parks & Open Space | 89,823 | 17.7% | 0.00 | 0.0% | 89,823 | 17.7% |
| Urban / Suburban Residential | 3,751 | 0.7% | 648 | 0.1% | 4,399 | 0.9% |
| Rural Residential | 8,406 | 1.7% | 2,329 | 0.5% | 10,735 | 2.1% |
| Rural Lands | 72,552 | 14.3% | 183,711 | 36.3% | 256,263 | 50.6% |
| Farming | 50,586 | 10.0% | 103 | 0.0% | 50,689 | 10.0% |
| Grazing | 54,024 | 10.7% | 0 | 0.0% | 54,024 | 10.7% |
| Total Unincorporated County | 289,632 | 57.2% | 189,287 | 37.4% | 478,919 | 94.5% |
| Incorporated Areas / Areas Outside Parcels ? ROW | - | - | 27,828 | 5.5% | ||
| Total County Land Area | 100% |
POTENTIAL LAND USE CONFLICT AREAS
The most obvious potential future land use conflicts in Napa County focus on potential urban growth and development, which could reduce the amount of agricultural lands unless it is confined to existing urban areas. Another area of potential conflict is the interface between agricultural and other uses. This interface has been addressed by “right to farm” policies, but complaints often surface when residents are inconvenienced by winery activities or farming practices. The following are among the most common causes of land use conflict.
- Urban limit lines
- Juxtaposition of agricultural and other uses
- State-mandated housing production in unincorporated area
- Juxtaposition of industrial lands and other uses
For the analysis of agricultural resources, the County was divided into 11 evaluation areas (totaling approximately 485,000 acres). Within these areas, approximately 51,000 acres are active agricultural land, containing primarily vineyards with smaller areas of crops and orchards. Approximately 53,800 acres are grazing land. (Napa County 2005) Agriculture is the leading source of revenue for Napa County. Wine grapes alone, produced in 2004, were valued at $350 million, and total agriculture in 2004 was valued at $357 million.
 Winery & vneyards |
The greatest and most obvious trend in Napa County is the conversion of Farmland of Local Importance, Grazing Land, and Other Land to Irrigated Farmland. This conversion has taken place on parcels ranging in size from 10 acres to 260 acres. Between 2000 and 2002, approximately 8,385 acres were converted from Farmland of Local Importance, Grazing Land, and Other Land to Irrigated Farmland. This conversion of agricultural land from one type to another is mostly due to the conversion of lower economic value grazing lands or orchards into higher value vineyards.
According to the Farmland Mapping and Monitoring Program (FMMP), the 11 evaluation areas examined all show their own unique trends concerning land use conversion between 1992 and 2002. For example, in the Lower Napa Valley, Angwin area, eastern mountains area, and central interior valley, urban and built-up lands have steadily increased over the years. Other areas, like the western mountains, pope valley, and Berryessa areas, have remained constant or decreased their urban and built-up lands. Urban and built-up lands are defined by the FMMP as “land occupied by structures with a building density of at least 1 unit to 1.5 acres, or approximately 6 structures to a 10-acre parcel. This land is used for residential, industrial, commercial, construction, institutional, public administration, railroad and other transportation yards, cemeteries, airports, golf courses, sanitary landfills, sewage treatment, water control structures, and other developed purposes.” (Note: FMMP produces maps and statistical data used for analyzing impacts on California’s agricultural resources. Agricultural land is rated according to soil quality and irrigation status; the best quality land is called Prime Farmland. The maps are updated every 2 years with the use of aerial photographs, a computer mapping system, public review, and field reconnaissance. For more information, visit the Farmland Mapping and Monitoring Program from the California Division of Land Resource Protection.
The acreage of grazing land has decreased in the majority of the evaluation areas. Acreage of Prime Farmland has increased overall in the Lower Napa Valley, Napa Valley floor, Pope Valley, and central interior valleys. Overall acreage of Prime Farmland has decreased in the Livermore Ranch area, Angwin area, eastern mountains, southern interior valleys, and Knoxville area. The acreage of Prime Farmland in the western mountains and the eastern mountains has fluctuated.
Napa County’s 11 evaluation areas currently have a total of 51,230 acres of potential cropland; 86,688 acres of other potentially productive soils; 135,969 acres of potential rangeland (or grazing land); and 40,542 acres of potential timberland (all numbers approximate).
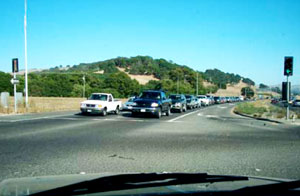
Napa County has traditionally been home to primarily rural agricultural communities. Recently, tourism and development pressures have been challenging the County’s transportation infrastructure. The transportation and circulation chapter describes an assessment of existing transportation facilities and conditions in the County.
The number of Napa County residents commuting in single-occupant vehicles has increased steadily since 1980. This trend corresponds directly to a decrease in the number of residents who commute by carpool, walking, and bicycling.
The following roadway segments currently operate near or above their capacities on a daily or peakhour basis.
- Portions of State Route (SR) 29 south of the City of Napa
- SR 29 between the northern Yountville City Limits and Bale Lane, north of Saint Helena
- Napa-Vallejo Highway south of the City of Napa
- SR 12, west of SR 29
- SR 12, near the eastern County Line
- Flosden Road, south of American Canyon Road
- American Canyon Road, east of SR 29
- Imola Avenue, east of the Napa-Vallejo Highway
- First Street, west of SR 29
- Trancas Street, between Soscol Avenue and Silverado Trail
In addition, there are several roadways in the County that are classified and designed as rural arterial streets that function similarly to highways, including SR 29, SR 12, and the Silverado Trail. These are the main roadways connecting cities within the County and connecting the County to other nearby urbanized areas. As such, they tend to carry relatively heavy traffic volumes traveling at relatively high speeds. By designing these facilities as rural arterials, numerous driveways and access points remain, creating conflicts between vehicles accessing adjacent land uses and traffic using these facilities for commuting.
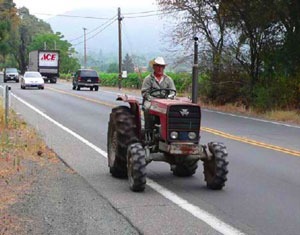 Rural roadways in Napa County serve a variety of users. |
The primary collision factor for automobile collisions in Napa County between January 2002 and December 2004 was unsafe speed.
Within the City of Napa, transit service is provided such that 85% of the city’s population is within ¼ mile of a bus stop; typical headways are 45 minutes. The smaller cities offer either a single bus deviated fixed-route system or demand response vehicles. Paratransit services are available in all of the cities and in much of the County. Vallejo is accessible by transit service operating on a 1-hour headway, and service to Santa Rosa is available via transit service operating on a 2-hour headway.
Within cities, bicycling and walking has the potential to play a relatively substantial role in transportation. Many cities in the County are on relatively flat ground, making cycling a viable option, although currently, cycling is not heavily used as a commute mode within the County. Additionally, many cities in the County are pedestrian-friendly and include desirable pedestrian amenities such as street-fronting businesses, relatively dense development, and wide sidewalks.
The primary factor for automobile collisions involving pedestrians in Napa County was pedestrian rightof- way violation. The primary factor for collisions involving bicycles in Napa County was bicyclists riding in the wrong direction. The City of Napa is currently implementing a program to install “Bicycle Wrong Way” signs on the back of bicycle lane signs in the city.
The only rail service in Napa County related to transportation is commercial freight transport. The Napa Valley Wine Train is a recreational service traveling between the Cities of Napa and St. Helena. However, this train is recreational in nature and does not play a role in Countywide transportation.
The only formally adopted traffic calming program in Napa County is within the City of Napa. This program has been in place since July 2005. To date, one set of traffic calming measures has been implemented within the city. Many more are expected soon.
There are no County-required transportation demand management (TDM) programs in the County. However, the County has established a “Trip Reduction Program” by which County employees who commute to work by alternative modes (e.g., carpooling, transit, bicycling, walking) are rewarded with cash bonuses of either $10 or $20 per month, depending on the employee’s participation rate.
The only transportation systems management (TSM) programs in Napa County consist of several sets of coordinated traffic signals in the City of Napa, three traffic-monitoring cameras, three emergency message signs, and a highway advisory radio system at key locations.
This chapter presents the visual and aesthetic resources in Napa County (County). The chapter discusses applicable policies and regulations and discusses the most recent case law decisions relevant to visual resource analysis and management in California. The section includes maps that present viewshed analyses and identify scenic corridors and major and minor ridgelines. The bulk of this chapter presents the visual resources of thirteen distinct evaluation areas within Napa County. The chapter concludes by recommending preferred methodologies and areas of particular focus for future assessment.
Established federal methodologies utilized by the Bureau of Land Management, Federal Highway Administration, and the United States Forest Service were reviewed for this visual assessment. The rationale for selecting a methodology for visual assessment that would not preclude the use of any or all federal methodologies in future evaluation of visual impacts is presented. The technical approach involved field research, the photo-textual presentation of visual resources in Napa County, and the preparation of maps that present viewshed analyses and identify scenic corridors and major and minor ridgelines.
REGIONAL & COUNTYWIDE CONTEXT
Just as Napa County is set within the diverse northern California landscape—centrally located with regard to urban centers (San Francisco and Sacramento) and geographic features (the wooded north coast region and the Great Central Valley)—the County contains within its boundaries a landscape that allows for great visual variety. Mountainous ridgelines running predominately north and south from the eastern and western boundaries of three major watersheds of Putah Creek, Suisun Creek and the Napa River. The accompanying streams and canyons of these watersheds surround Pope Valley and Lake Berryessa, Wooden Valley and the Napa Valley Floor. The setting provides for a rich and varied discussion of visual and aesthetic resources.
COUNTYWIDE VISUAL & AESTHETIC RESOURCES
For purposes of this visual analysis, Napa County was divided into thirteen evaluation areas: Napa River marshes, Jamieson/American Canyon, Carneros area, Napa Valley floor, western mountains, eastern mountains, Angwin area, Livermore Ranch area, southern interior valleys, central interior valleys, Pope Valley, Berryessa area, and Knoxville area. Each of these evaluation areas offers a distinct landscape character. A general description is provided for each area, detailing its location, landscape character (i.e., type of vegetation, the presence of water, general color and texture of the area), and the degree to which its environment is built, managed, or natural. Unique visual resources are identified for each and described and supported with accompanied by photographs. Typical viewers in the area are described, followed by a discussion of the changes, if any, in the landscape over the past decade, and what effect those changes might have had on the area’s visual character.
Numerous public and private entities located in both the unincorporated areas of Napa County as well as the incorporated Cities of American Canyon, Napa, St. Helena, Calistoga and the Town of Yountville, provide potable water, sewer and wastewater services, solid waste, law enforcement, fire protection, medical facilities, schools, farmworker housing, recreation, and social services to unincorporated Napa County.
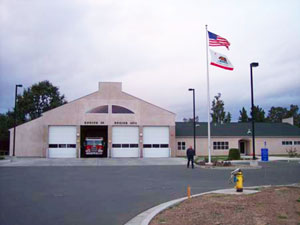 CDF/County Fire Station |
The majority of water suppliers and sewer service providers to Napa County appear to have more than sufficient capacity related to current demand. However, the County would not have sufficient water or sewer capacity if they were to expand urban development in the unincorporated areas. LAFCO policies discourage the County from planning for urban development in the unincorporated areas, and instead encourage cities to annex those areas slated for urban development and then extend their existing water and sewer systems to serve the new development (Napa County 2004b).
All of the solid waste landfills where Napa County’s waste is disposed have more than sufficient capacity related to the current waste generation.
The majority of the providers of Fire Protection in Napa County have average to poor Insurance Services Office (ISO) ratings. The objective of the ISO is to provide a tool for the Insurance Industry to measure quantitatively, the major elements of a City’s fire suppression system.
Recently, the farm worker housing providers in Napa County appear to have more than sufficient capacity related to current demand; however, this is not to suggest that more housing won’t be needed in the future. Recently completed studies have shown that the number of additional farm worker camp beds that could be filled within the County is between 100 and 400.
Visitation is expected to increase in many of the parks and recreational areas in Napa County while many are understaffed.
Most of the social services in Napa County have adequate staff to meet the demand.
This chapter summarizes the discussion of cultural resources in Napa County. Discussed in detail in the chapter are the methods used to identify and create maps of known archaeological, historic, architectural, recreational, and scientific resources; the likelihood and type of future finds expected; and conclusions regarding cultural resource importance in the County.
There are many unique archaeological resources in Napa Valley, and the ethnographic record of the region shows the cultural complexity at the time of European-American contact. Napa County also played a historically significant role in the development of California and the West. The record of significant historic properties within the County is extensive and will surely grow as more properties are identified and evaluated.
It is clear from the synthesis of information shown on the maps and in the datasets that Napa County was a rich resource base and home to many thousands of Native Americans stretching back for thousands of years. The archaeological and broad historical record of the County are important resources significant not simply to California, but to North America.
The initial effort to identify cultural resources in Napa County was limited to information provided by Napa County and the information obtained from the Northwest Information Center (NWIC) and provided by Napa County. A more intensive study utilizing primary and secondary historic source information as well as field surveys would be needed to expand the utility of the information presented in this chapter. Themes researched and documented should be tailored to address those events of Napa County’s history against which cultural resource evaluations can be reasonably measured for historic significance on a more localized level.
Context
PREHISTORIC CONTEXT
The first recorded archaeological work in Napa County and many of the Bay Area communities was conducted in 1909. Early work noted that the shellmounds in Napa County exhibited large concentrations of ash and earth, which suggests a broad subsistence base. Minimal archaeological work was conducted in the Napa region between 1909 and the 1940s, at which time work began to concentrate on excavation of large habitation sites, extensive survey, and large-scale excavations.
From the late 1940s to the mid and late 1960s, American archaeologists’ developed a new approach that focused on how and why people chose to organize, develop, modify, or discard certain modes of adaptation. The Central California Classification System was therefore revised to synthesize the state of current knowledge in central California archaeology.
Recent archaeological investigations in Napa County have been conducted in response to the increasing level of development in the area. Investigations have focused on management goals and site-specific mitigation (Jaffke and Meyer 1998). Many of the recent archaeological investigations have aided in the understanding of the prehistoric people who inhabited the Napa region. These investigations have advanced knowledge of the strategies used by the prehistoric cultures to adapt to their environment, changes climates, and intertribal technological and cultural influences. Archaeological artifact anaylsis and chronological dating methods have made understanding the adaptive processes of the prehistoric cultures more accessible through such techniques as the study of obsidian hydration dating techniques, trace element analysis, and radiocarbon dating (Moratto 2004).
ETHNOGRAPHIC CONTEXT
Artifacts indicate that the earliest dates of human occupation in Napa Valley are approximately 5,000 years ago (Bennyhoff 1994). Archaeological record shows that the Napa region was inhabited in prehistoric times primarily by the Wappo, Lake Miwok, and Patwin tribal groups. As with most of the hunting-gathering groups of California, the 50- to 150-person tribelet represented the basic social and political unit. The acorn was the primary plant food, along with a variety of roots, bulbs, grasses, and other edible greens; and deer, elk, and antelope were the primary big game. Trade was common. With the advent of the mission system in the latter half of the 1700s, the numbers of Native Americans in the Napa region decreased rapidly, as did all Native American populations throughout the Bay Area and California.
HISTORICAL CONTEXT
Settlement
In 1823, the first recorded European explorers in the upper Napa Valley traveled through the area in search of a site for a new mission. They explored present-day Petaluma, Sonoma, and Napa before eventually settling on Sonoma as the new mission site (Hoover 1990).
In the 1830s, the Napa Valley became one of the first in California to be settled by American farmers. In 1836, George C. Yount was baptized as Jorge Concepcion Yount and became a Mexican citizen; he then received the Rancho Caymus land grant in the Napa Valley, which included more than 11,000 acres, from the Mexican government. This grant marked the beginning of the rancho period in the Napa region in which cattle and horse ranching was conducted on extensive ranch spreads. The rancho period continued until 1850, when California became part of the United States, although cattle ranching continued on after statehood.
When California was granted statehood in 1850, the Napa Valley was in the territory of California, district of Sonoma. In 1850, when counties were first being organized, Napa became one of the original 27 counties of California, with Napa City (later shortened to Napa) as the county seat.
The Gold Rush of the early 1850s caused Napa City to grow. After the first severe winter in the gold fields, miners sought warmer refuge in the young city, and some worked on the cattle ranches and in the lumber industry. Sawmills in the valley were cutting timber that was hauled by horse team to Napa City, where it was then shipped out via the Napa River to Benicia and San Francisco.
Viticulture Industry
The Napa Valley is known mostly for its premier wines. At the start of the industry, Euro-American settlers planted vineyards with cuttings supplied by Catholic priests from Sonoma and San Rafael. Wine production increased between 1845 and 1847. Little effort was made to improve the variety of mission grapes, growing techniques, or winemaking process until the mid 1850s, when zinfandel was introduced into California. Other European varietals, including Riesling, were introduced in the Napa Valley in the 1860s. During this time, the United States market for California wines was generally based on inexpensive price, rather than a sophisticated palate (Ferneau et al. 2000).
By the mid 1870s, grapes had become a major crop in the region. St. Helena became the focal point of wine growing in the Napa Valley (Ferneau et al. 2000). By the late 1870s and early 1880s, wine growers gradually began to replace old or diseased vines with a variety of the best European varietals. With experience, growers extended their vineyards into hillier terrain, where vines were less affected by hard valley frost, and planted other varieties, such as cabernet sauvignon, cabernet franc, and merlot. While total output varied over the years, California saw a relatively steady increase in wine production.
Agricultural diversity began to increase in the late 1800s in response to the problems that faced the wine and wheat industries. Fruit growing—apples, peaches, olives, and prunes—was a major enterprise in the late nineteenth century. The wine industry did not recover until the 1950s, after the Great Depression and World War II.
The surface water hydrology chapter describes the baseline conditions for surface water hydrology of Napa County. This chapter is one of three chapters related to the hydrological system of the County. The hydrological system represents the occurrence, movement, and distribution of water movement in the air, on the ground, and beneath the surface.
The three hydrology/water-related chapters of the BDR characterize surface water, groundwater, and water quality conditions. These chapters also describe developing a regionally integrated surface water, groundwater, and water quality models developed for Napa County. It is important to note that the three-part surface water hydrology, groundwater, and water quality analyses and models were conducted and developed with the understanding that such models and analyses would be applied towards future planning considerations. More specifically, the hydrology studies were designed to establish baseline conditions by which Countywide projects and programs could be assessed and evaluated for their planning benefits, constraints, and environmental impacts.
Prior to building a model of the Napa County hydrologic system, the main features and driving forces of the natural hydrologic system were identified based on existing information, past studies, field visits, and engineering hydrology judgment. A conceptual model was then developed to describe hydrologic functioning, identify the significant hydrologic variables needed in the model, and provide a basis to advance the analysis and develop a valid mathematical model.
 |
INTEGRATED SURFACE WATER MODEL
The integrated surface water, groundwater, and surface water quality models developed for the Napa BDR project are based on the MIKE SHE/MIKE11 code developed by DHI Water and Environment. The MIKE SHE/MIKE11 code is a physically based, distributed hydrologic model that simulates the major flow components of the hydrologic cycle, making it very well suited for simulating current and future water distribution in Napa County. Results from the surface water model include monthly values, graphs, and maps for all the major flow components of the hydrologic cycle; stream hydrographs; and water surface profiles. These models are also scalable, which allows for regional modeling as well as with more spatially detailed data, examination of the local effects of a project on the hydrologic system.
The principal flow components in Napa County’s hydrological system include precipitation, evapotranspiration, overland flow, surface water runoff, vadose zone flow, and groundwater recharge. These components were each accounted for in developing the MIKE SHE/MIKE11 hydrology model of Napa County.
MODEL DEVELOPMENT
Drainage Network, Subbasins and Streamflow
Independent models were developed for the hydrologically separate Napa River, Putah Creek, and Suisun Creek watersheds Each basin was further subdivided into a total of 188 subbasins to provide the County with a comprehensive set of subbasin planning units that could each be evaluated for baseline and alternative conditions. Delineation of the subbasin boundaries was based on Digital Elevation Maps (DEMs) of the County. Napa County covers approximately 728 m.2 and the model uses a grid size of 250 m. For purposes of flow routing, a principal drainage in each of the 188 subbasins was used for downstream routing.
Precipitation and Evapotranspiration
Precipitation distribution in Napa County is influenced by regional weather patterns as well as local county microclimates. In the Napa River Watershed, 69 precipitation polygons were linked with precipitation records to simulate the historic distribution of the precipitation. Evapotranspiration for all models used the rates from the CIMIS Oakville, Carneros, and Angwin stations.
Land Cover
For modeling land cover, vegetation types described in the Biologic Resources Chapter of the BDR were used to describe bare ground, coniferous forest, deciduous shrubs, deciduous woodland, developed, Eucalyptus woodland, evergreen broadleaf wood, evergreen scrubland, grassland, rock outcrop, unclassified, vineyard, water, and wetland land covers. Parameters for rooting depth, leaf area index, overland flow roughness, and evapotranspiration were determined for each vegetation class.
Soil Water & Groundwater
Simulation of groundwater used a two-layer water balance to represent the shallower vadose zone and a series of linear reservoirs to simulate deeper interflow and base flow zones. The Natural Resource Conservation Service’s (NRCS) Soil Survey Geographic Database (SSURGO) was used as the soil base data including depth, saturation conductivity, saturation point, wilting point, and field capacity. Napa County general soil types include: clay loam, deep clay, deep fine loam/clay, gravelly loam, loam, rock, undeep loam, and undeep loam/gravel. As part of the Groundwater Resources analysis (Chapter 16 of the BDR) a more complete physically based integrated surface water-groundwater model was developed for areas of the County that currently use significant portions of groundwater.
Water Use
In the northern Napa River Watershed, the majority of water demand is for agricultural use (about 80%), with 12% for municipal and industrial use, and 8% for other rural use. Water sources include: 60% from groundwater, 26% from diversion of water from the Napa River, 11% from municipal reservoirs, 1% from water imported from outside the watershed, and 1% from reclaimed water. In contrast, in the southern portion of the watershed, including the City of Napa, the majority of demand is for municipal and industrial use (about 65%), with 28% for agricultural use, and 7% for rural use. In the southern watershed, water sources include: 31% from municipal and other reservoirs, 29% from water imported from outside the watershed, 26% from groundwater sources, 7% from diversion of water from the Napa River and other rivers, and 7% from reclaimed water. In the Lake Berryessa and Suisun Creek Watersheds about 98% of water demand is for agricultural use, with 2% for rural use, with 46% coming from groundwater, 21% from Lake Berryessa and other reservoirs, 19% from diversion of water from the Napa River and other rivers, 11% from water imported from outside the watershed, and 3% from reclaimed water. In 2001, 34,900 acres of agricultural lands were under irrigation in the Napa River Watershed and 2,600 acres of agricultural lands were under irrigation in the Lake Berryessa and Suisun Creek Watersheds. This agriculture is almost entirely (96-98%) vineyards and the remaining lands are pastures and lands producing other truck crops. Irrigation applied water was 38,600 ac-ft for vineyards, 1,500 ac-ft for pastures, and 700 ac-ft for other truck crop areas in the Napa River Watershed during 2001.
MODEL CALIBRATION
| Groundwater hydrologic analyses and modeling conducted in support of the BDR were undertaken with the intention of applying the models and analyses for future planning. |
Model calibration compares model results with actual streamflow data. In this way, model results are directly evaluated to see if “too much” or “too little” streamflow resulted from the modeling simulation, compared to how observed precipitation events resulted in streamflow. Stream gauge data is available along nine stations along the Napa River system in the western study area, as well as at two locations along Putah Creek: one downstream of Monticello Dam and the study area and the other upstream of Lake Berryessa and the study area. Additional historical (1961–1980) discharge data is available at five locations within the study area.
RESULTS
The Napa County MIKE SHE/MIKE 11 model is a dynamic model that can be refined and expanded as data becomes available and as new questions are identified. As the model is currently set up for regional analysis of the Napa County hydrologic system, it can be used to help evaluate alternatives developed as part of the current updating of the Napa County General Plan. In this way, the model can also be used to support a countywide program Environmental Impact Report of the General Plan Update (including evaluation of cumulative impacts). As described above, with adequate local data, the baseline model can also be developed for more localized and site specific environmental analyses of specific projects. In turn, the development of local information for site-specific projects can then be “returned” or input into the broader countywide model to also improve the accuracy of the regional model. A more complete description of the surface hydrology model and its results are found in a separate hydrology report (Napa BDR Surface Hydrology Modeling Report).
The model will be suitable for these purposes and provide a basis to compare alternatives and evaluate environmental impacts.
Current and more updated information on Napa County's groundwater resources and management actions related to the California Sustainable Groundwater Management Act (SGMA) is available here on the WICC.
In 2004 the BDR describes groundwater in Napa County, documents the groundwater system, and describes the methods used to determine existing groundwater hydrology and the policies that apply to groundwater in Napa County. This chapter also describes the approach and data used in developing a local integrated surface water and groundwater model. The Groundwater chapter is complementary and builds on the general surface water hydrology discussion presented in Chapter 15, Surface Water Hydrology, of the BDR. A supporting technical report (Napa BDR Groundwater Hydrology Modeling Report) was developed and includes a more complete documentation of the groundwater model construction, calibration, sensitivity analysis, and presentation of results. Consulting hydrologists from DHI Water & Environment led the surface hydrology, groundwater, and water quality tasks of the BDR (Chapters 15, 16, and 17, respectively), working collaboratively with other specialists from the Jones & Stokes/EDAW project team.
A physical-based integrated surface water/groundwater (ISGW) numerical model was refined for the groundwater resources chapter. The MIKE SHE/MIKE-11 groundwater model builds on the surface model described in the surface water quality chapter of the BDR, expanding the original model’s capabilities to analyze groundwater resources as well. To facilitate the analysis of groundwater resources, the County was divided into 11 evaluation areas. Extent of the groundwater analysis focuses on the aquifers underlying the 11 evaluation areas. The resultant MIKE-SHE ISGW model represents the subsurface domain (saturated zone) as a single- or multi-layered two-dimensional model, depending on the geological and hydrogeological description.
Review of existing documents and collection of data was undertaken to support the development of the MIKE-SHE ISGW model. From the literature review, no regional groundwater studies or models that address the groundwater resources comprehensively across the County were found. USGS produced a groundwater model in the Lower Milliken-Sarco-Tulucay Creek area to examine groundwater resources in that subregion of the County. This document provides valuable information on the aquifer dimensions and properties in this area. Several regional studies of the groundwater resources studies and records from the California Department of Water Resources provide pumping rates throughout the evaluation areas. Well hole logs with geological information are also being investigated to construct the subsurface model.
The MIKE-SHE ISGW will allow the County to examine surface and groundwater use in the 11 evaluation areas. Specifically, the groundwater chapter of the BDR includes a technical report with estimated groundwater usages, water balances, groundwater elevation trends, appropriate maps, time-series graphs, and other graphics for each evaluation area. The following maps, at a scale of 1:12,000, are included in the groundwater resources chapter.
- Groundwater basins/recharge areas map showing well locations, groundwater flow patterns, recharge areas, discharge areas, and zones of influence
- Groundwater elevations/depths map
- Groundwater short areas map.
In addition, time-series graphs of water level conditions and derived information will be provided.
For the surface water quality chapter of the BDR, GIS-based soil erosion, sediment loading, and nonpoint source water quality loading tools are coupled to the MIKE-SHE integrated model developed for surface hydrology and groundwater to determine annual loadings and transport to (and within) the stream network. Specific constituents examined include sediment, temperature, nitrate, total phosphorus, and coliforms (e.g., E. coli). The dynamic coupling between the loading model and water quality modeling provide a tool for:
- analyzing current water quality conditions,
- assessing cumulative impacts of water quality following future land use changes in the watershed.
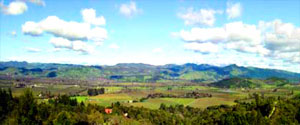 In the higher elevations, geologic structures that surround the structural troughs/basins of the County create source areas for surface water and groundwater. |
Where possible, the water quality analysis is making use of existing and available water quality information from on-going studies, including the TMDL process, Napa nutrient analyses, and other studies. Loadings are assessed using a GIS-based non-point calculation tool. Different types of land use have different run-off concentrations of nutrients, organic matter, and bacteria. Predominant land uses include: residential, commercial, industrial, mixed (variety of land uses), transportation, open space, forest, wetlands, and agriculture. These run-off concentrations are often refereed to as the land use estimated mean concentration (EMC). The pollution load from agricultural activity (primarily the use of fertilizer and domestic animals) is included in the non-point pollution load estimation. The GIS tool also links point sources and provides a first screening-level of assessment of the combined pollutant loadings. The GIS tool is applied to estimate the total load from the housing in the rural areas, taking the local treatment system efficiencies into account.
Potential sediment loading arising from soil erosion is analyzed based on available information about topography, soils, vegetation, land use, and rainfall. The analysis is a combination of GIS-based soil erosion modeling and evaluation of existing data. The soil source erosion assessment is applied to describe delivery index and sediment yield (ton sediment /acre/year) for all drainages. These soil erosion rates are applied as loadings to an in-stream sediment transport model that is fully integrated with the MIKE-SHE model developed. The river sediment transport model (including the main stem Napa River and major tributaries in the Napa River watershed only) will transport sediment as either suspended sediment or bedload. The model predicts areas prone to sedimentation and erosion and predicts total loadings from the watershed to the San Pablo Bay.
The coupling of GIS-based tools and MIKE-SHE ISGW allows the County to examine loading of water quality constituents and sediment throughout Napa County.
Results for the Surface Water Quality analysis are documented in a supporting technical report (Napa BDR Surface Water Hydrology Modeling Report), which includes a more complete description of the models’ data requirements, computational algorithms, and outputs. Resulting maps include:
- Surface water pollutant-level maps for temperature, nutrients, organic material, and pathogens
- Sediment source map
This chapter of the BDR focuses on the ecological role of fire in the County’s biotic communities. The purpose of this chapter is to establish baseline data that will allow for the analysis of impacts on biological resources due to changes in the fire regime as the population of the County increases, development patterns change, and decisions and policies are considered regarding fuel management.
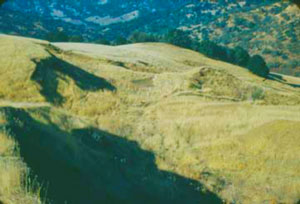 California native grasslands have been identified as one of the most endangered ecosystems in the United States, so it is important to carefully consider the effects of fire on this grassland assemblage. |
Fire suppression over the last 50 to 100 years has resulted in a decrease in fire frequency in many of the County’s biotic communities. The reduction in fire frequency has likely led to declines in some special-status species that are favored by fires, and the degradation of some sensitive communities. Serpentine grassland is an example of one such sensitive community, which has undergone invasion by barbed goatgrass (Aegilops triuncalis), a fire-intolerant noxious weed. There are two principal mechanisms by which fire suppression threatens the County’s biotic communities and special-status species: increased dominance by less fire-tolerant species, and increased probability of severe standreplacing fires.
In some communities, the reduction in fire frequency has led to a buildup in fuels (biomass) such as woody shrubs and downed wood. Increased fuel loads have increased the probability of extensive and severe fires. Such fires have the potential to cause the loss of sensitive communities such as oldgrowth Douglas-fir–ponderosa pine forest, which would lead to declines in special-status species such as the northern spotted owl (Strix occidentalis caurina) that are dependent on this habitat.
The probability of extensive stand-replacing fires in many biotic communities in the County is increased by the spread of human development adjacent to natural areas. Increasing human development (including roads) is correlated with the frequency of wildfire ignitions. In contrast, agricultural development adjacent to natural areas has reduced the probability of extensive and severe fires in some areas. Vineyards have lower fuel loads than biotic communities such as oak woodlands, chaparral, and coniferous forest.
Most of the County’s biotic communities are at moderate risk of losing key ecosystem components due to changes in the fire regime. These communities include non-native grasslands, xeric and mesic chaparral, and some areas of riparian woodland, oak woodland, and coniferous forest. Significant portions of the County’s oak woodlands and coniferous forests are at high risk of degradation or type conversion due to the increased probability of severe fire.
There is also a strong need for better local and regional land use planning to slow or halt the increase in fire risk as the population increases and development spreads. Such planning is particularly important for the wildland urban interface, where developed areas and wildlands meet and where extensive property damage and loss of life from fire is typically concentrated (California Department of Forestry and Fire Protection 2000).
As the County population continues to grow, local, state, and federal agencies charged with biodiversity conservation and fire protection will continue to struggle with increased sources of ignition, the demand for increased fire suppression, and the concomitant changes in fire regime that accompany a growing population and continuing development. This report takes an initial step to assess and address fire management needs in the context of local land use planning in Napa County.